


Companies in banking and securities, healthcare, manufacturing, insurance, transportation and trade generate massive amounts of data. Yet deriving meaning from the data remains a challenge. Data Analytics plays a crucial role in unlocking the hidden potential of this information, serving as a guiding light for informed decision-making across various industries.
Massive amounts of data, generated across industries like banking, healthcare, and manufacturing, flow from diverse sources. Through a process of standardization and transformation, this data becomes ready for injection into the Analytics workflow. Here, powerful Big Data Analytics techniques are used to sift through the vast information, uncovering valuable patterns. These patterns are then transformed into actionable insights, often through the power of Data Visualization, providing the foundation for data-driven business decisions.
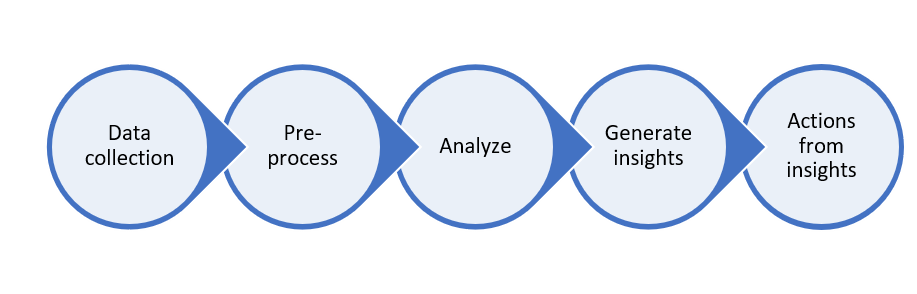
Fig 1: Data Analytics Pipeline
Ongoing Challenges in Analytics
The journey of going from data to insights requires a team consisting of data scientists, machine learning engineers, domain experts and analysts. They collaborate to make sense of this data – which requires a significant investment of time and resources. Adding to that, data collection and pre-processing tasks like cleaning data, labeling data infamously account for 60-80% of the time of the Data Scientist. The analysis is a time-consuming manual task of selecting features, finding parameters to discover patterns. Insights to be inferred from these patterns are for decision-making, and business users require familiarization with sophisticated Visualization and Business Intelligence tools like dashboards and reports.
Augmented analytics addresses these challenges by automating the analytics workflow to deliver unbiased decisions and impartial contextual awareness. It will transform users’ interaction with data – from how they consume it to how they act upon it.
Augmented Analytics: The Road Ahead
Gartner defines Augmented analytics as
“A next-generation data and analytics paradigm that uses machine learning to automate data preparation, insight discovery and insight sharing for a broad range of business users, operational workers and citizen data scientists.”
Augmented analytics will impact multiple stakeholders in the existing workflow. Automating data preparation will help the data scientists to spend more time on sophisticated tasks and decrease efforts spent manually on cleaning data. Data scientists, engineers and customers can obtain insights at a much faster rate and with lesser bias compared to time-intensive manual methods.
Augmented analytics will also lead to the rise of Citizen Data Scientists – a person who creates or generates models that use predictive or prescriptive analytics, but whose primary job function is outside the field of statistics and analytics. This empowers them to interact with simple to moderately sophisticated analytic applications that without augmented insight discovery would require deeper expertise.
Focus Areas to Accelerate Insights
Augmented analytics automates insights using machine learning and allows interaction using natural-language. It is achieved by focusing on the four important areas:
- Augmented data preparation using machine-learning for collating, cleansing and enrichment of data.
- Advanced analytics automates feature selection, hyperparameter tuning in modeling, pushing people in the workforce without the specialized skill set to handle advanced analytics.
- Augmented data discovery generates the most relevant statistical insights. It recommends the best way to display data, enabling business people and data scientists to understand and visualize clusters, correlations, forecasts and trends without building models or write algorithms.
- Integrating Natural-language query and conversational analytics with data discovery can drive analytics adoption by allowing business users to interact with data using natural language. This can be carried out even on mobile devices to query the most pertinent actionable insights by interacting with digital assistants.
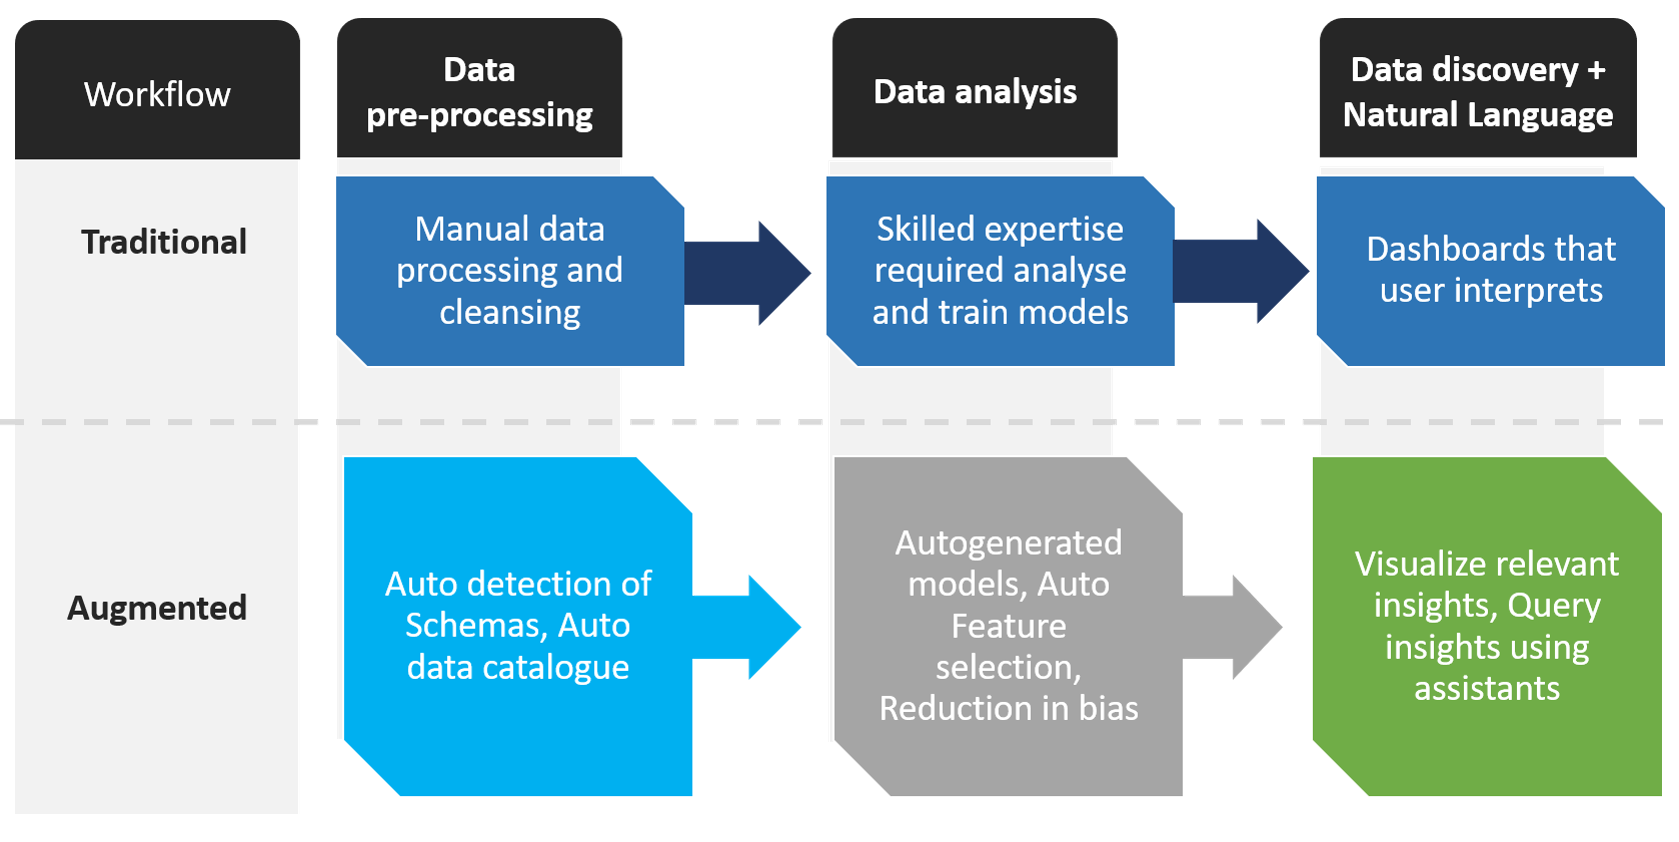
Fig 2: Traditional vs Augmented Analytics Workflow
Tools to Drive Augmented Analytics
Augmented analytics tools are in their nascent stages. Many cloud providers are working towards providing advanced analytics with Auto ML solutions that aim to enable any developer to use ML for building high-quality models with minimal expertise.
- Google Cloud Platform’s Cloud AutoML: It enables developers to build state-of-the-art models by interacting with simple user interface within minutes. It also helps with tedious jobs of labeling data. AWS’s ML services provide fully managed automated model building, training, model tuning and deploying capabilities.
- Azure’s Automated ML: It currently supports regression and classification problems.
- Auto-sklearn AutoML: Open source modules like sklearn have auto-sklearn toolkit for algorithm selection and hyperparameter tuning by leveraging Bayesian optimization, meta-learning and ensemble construction.
- H2O AutoML: There are platforms like H2O that make it easy for the non-experts to perform experiments with machine learning using its AutoML functionality that automatically runs through all the algorithms and their hyperparameters to compare and build the best model.
These tools will reduce time-consuming exploration, identification of false insights, efforts spent on creating and building models, thereby helping data scientist to focus on more meaningful tasks.
Visualization of Patterns through BI Tools
The patterns generated through these models can be visualized by various BI tools, one of which include Qlik that plots auto-generated charts, forecasting important features and important correlations from data. Qlik bridges the gap between visual discovery and conversational analytics by interfacing through a Bot (CrunchBot) enabling users to query using Qlik Sense UI, Slack, Skype, Salesforce Chat and Microsoft Teams. It also powers interactions by voice to services like Amazon Alexa.
Analytics Game Changer
Adoption of these augmented analytics tools will minimize time-consuming exploration tasks, help in identifying biases and reducing errors. Advanced analytics will propel the transition towards data-centric business without completely relying on data science professionals. Automation of the data to insights using augmented analytics will enable the enterprise workforce towards an accelerated decision-making process.
Reference
[1] Gartner.com