
Blog
Predictive Analytics – Part 1
Blog
Predictive Analytics – Part 1


Prediction is booming. Nowadays, the prediction is done by machines using artificial intelligence and machine learning. Classified under the broad area of business analytics, predictive analytics has the power of answering the question as to what is likely to happen. Here historical data is combined with rules, algorithms and occasionally external data to determine the probable future outcome of an event or the likelihood of a situation occurring. It is widely used in commerce, manufacturing, healthcare, government and law enforcement.
Why is Predictive Analytics (PA) gaining so much importance in today’s world?
Today, data is the new oil growing by an estimated 2.5 quintillion bytes per day (that’s a 1 with 18 zeros) after it. This data is in the form of text, images, audio, video and other sources. With so much data available, it simply becomes a goldmine that can be used to predict customer behavior, fraud detection, and the occurrence of any medical illness or incidence of crime. However, currently, less than 1 percent of it is being used for analysis. Research projects that the predictive analytics market will reach 6.5 billion dollars in the next few years. Organizations can better equip themselves and learn to take advantage of future opportunities or mitigate future risks by using PA as their instrument in their operations.
Heard of these popular application areas of Predictive Analytics?
- Hollywood studios use PA to predict the success of a screenplay if produced.
- Predicting mouse clicks on a website i.e. where or on which link on a website would a visitor click.
Demystifying the jargon in Predictive Analytics:
In this blog, we will be demystifying the jargon used in PA that include bias creeping in, problems caused in training a model, the algorithms used in predictive analytics and crowdsourcing.
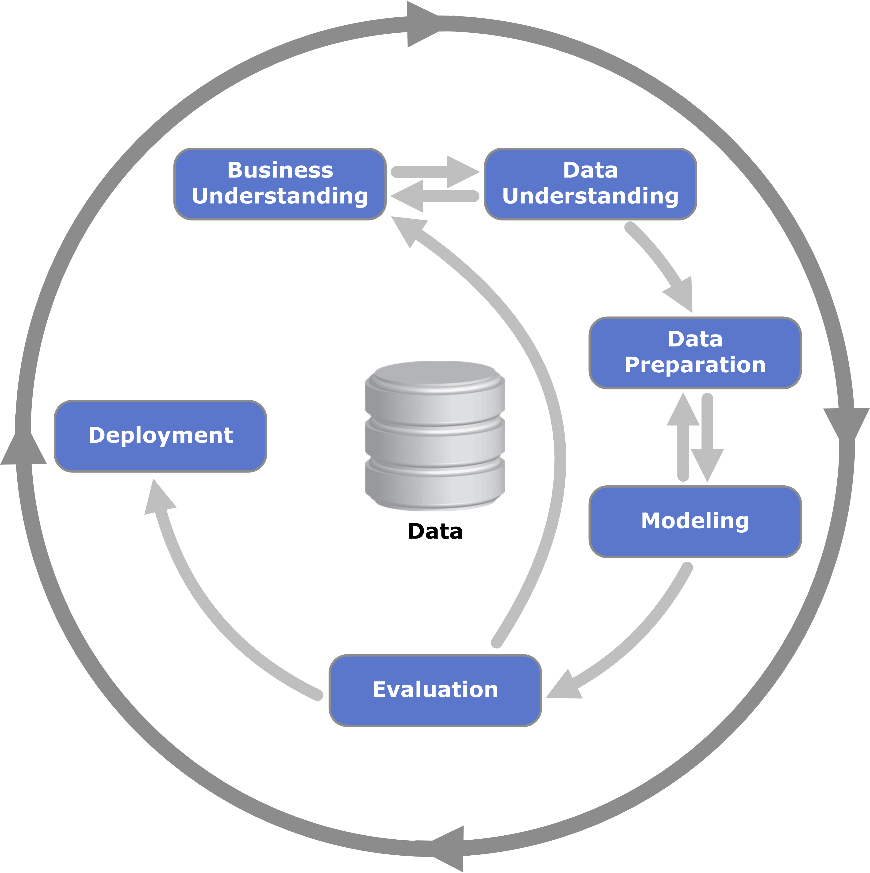
Predictive analytics uses machine learning, statistics and data mining to scan and process historical data, find patterns in it, learn from it and then create a model to predict future behavior or outcomes.
The term “Model” in Predictive Analytics means a mathematical representation of a real-world process.
Once trained, the model would be able to make future predictions on unseen data.
Since PA applications are used primarily to predict an outcome, it could very well happen that it predicts something wrong. i.e. a false alarm or in technical terms, a False Positive. The next topic dwells on this very common aspect of Predictive Analytics.
The Inherent risks of false predictions i.e. False Positives:
If we take an example of predictive analytics being used to predict the cancer diagnosis of a patient. The outcomes of predictive analysis can be categorized into four areas, namely:
- True Positive
- True Negative
- False Positive
- False Negative
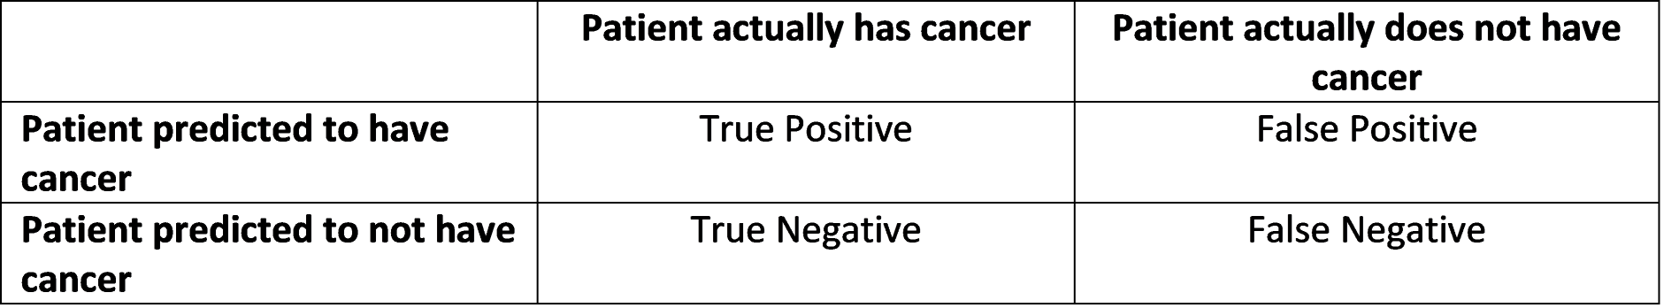
Very often PA may find correlations in data that are not real and true which are false positives. The effects of this can be disastrous (wrongly predicting that a jail inmate would commit a crime in the future and thereby increasing his tenure in prison), while some less disastrous (a company predicting that a customer would churn, when actually he would not) depending upon the domain and type of prediction made.
A PA application would predict based on what it is taught during training. So, just like humans, if the model is trained (taught) to discriminate or show favoritism, then the application would predict future data with the same unfairness or inequity. This aspect, also known as bias, is what we shall discuss in the next section.
The problem of bias creeping in the models:
Data is so vast that it is impossible to use the entire universe of available data for training purposes. So, the data used must be a fair, unbiased and identical representation of the entire available data set and accurately represent the future environment that the model will operate in. Very often it is observed that bias creeps into the model that is created using PA.
Examples of bias caused due to the data -:
- Partiality has done on job candidates based on skin color or “ethnic-sounding names”
- Using religious views to set different pricing for one customer over another
- Gender-based bias to pay one person more than another despite equal performance.
- Terminating someone wrongfully without cause due to sexual orientation.
When the training data is small and limited in size, it may so happen that the model is trained repeatedly several times on the same data. In such cases, the problem of overfitting can occur, which is described in the next section.
What is Overfitting and why is it such a commonly occurring problem while building PA or ML models:
When the model is overtrained on the same data, then the problem of overfitting occurs.
This type of problem occurs when the model created literally memorizes the training data due to which it makes poor predictions on the test data.
Example -: While preparing for an exam in math, just suppose the student memorizes the answers for the problems. Subsequently, while attempting the final exam, he would not know how to answer the problems because he had earlier memorized the answers to questions because of which he would fail to think, to arrive at the solution for the problems in the actual exam.
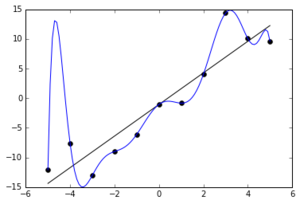
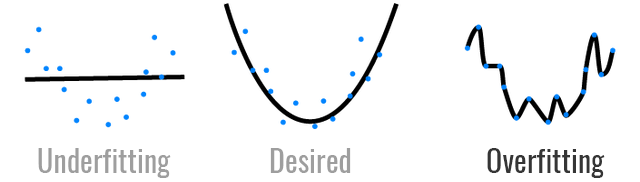
In the above figure, the straight line is the generalization that is desired so that the same model represented by this line would predict well on unseen data as well. However, when even the noise in the data gets mapped onto by the model, as indicated by the blue curve, then overfitting is said to have occurred. It is no doubt that the polynomial represented by the blue curve is a perfect fit, but the model represented by this polynomial would predict accurately only on the training data and would perform or generalize poorly on the test data.

As seen in the above figure, “Underfitting” occurs when the model predicts poorly on the training and test data sets. In the first figure above, the straight line is a poor representation or generalization for the pattern represented by the blue data points. The straight line model is too simple with regards to the data it is trying to model. What is desired is a more complex model as depicted in the second figure above. So, the solution to underfitting is to increase the model complexity. I.e. using a polynomial function instead of a straight line function.
Algorithms are a set of rules used by the computer in order to perform some calculation or solve a particular problem. There are several algorithms that are used today in machine learning or PA activities, some of which we shall discuss in the next section.
Algorithms used in PA:
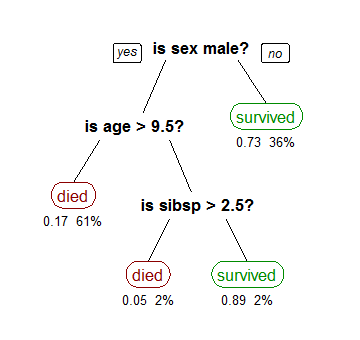
Decision Trees are the most commonly used algorithms because they are transparent and easily interpretable.
Decision Trees follow the “if-then” pattern at each node and so rules can be easily deciphered from a decision tree by which one can know which are the input variables or features that are the most important and relevant in predicting the result.
Decision Trees are resistant to outliers, missing data and skewed distributions.
Other algorithms like Linear Regression, Logistic Regression, Neural Networks and Support Vector Machines (SVMs) can also be used.
However, these are less transparent and are not easily interpretable.
If the use case requires interpretability, like determining customer churn or incidence of cancer, then use Decision Trees.
If the use case does not require interpretability like in fraud detection, then use Logistic Regression.
Decision Tree -:
When demand far exceeds the supply, which is generally always the case when any new technology comes in, an efficient way to tap the best talent is to crowdsource – a practice described in the next section.
What is crowdsourcing and why it has an advantage?
Crowdsourcing is a common practice employed by organizations to engage a ‘crowd’ or group of people towards a common goal. For example, Netflix organized a competition wherein people from across the world were invited to create a PA model that would increase Netflix’s movie recommendation predictions by 10%. By organizing such a competition, Netflix could tap the best talent from across the globe.
This brings us to the end of the first part of predictive analytics. Stay tuned for Part 2 where we will simplify the concepts of correlation and causation, ‘Vast Search’ and ‘The Curse of Dimensionality’, why PA identifies only micro risks, Ensemble Models, Persuasion Modeling and Survival Analysis.
Please refer to our Whitepaper for more details.


