
Blog
Customize Your Dashboard in Qlik


Tutorial: Qlik Sense Customization
Qlik Sense is a modern web-based self-service analytics BI (business intelligence) tool. With its powerful in-memory indexing engine, Qlik Sense provides an associative model to explore, search and analyze data. It offers numerous charts and analysis capabilities. And in situations where traditional Qlik Sense functionalities do not deliver the desired outcome, there are many ways to customize the tool. In this blog post, we will primarily focus on achieving visual enhancements by designing a new layout, charts and achieving inherent Qlik properties for the custom objects.
Challenges
Qlik offers numerous ways – through extension objects, mashup and external APIs – by which one can enhance the user experience and improve interactions. The primary challenge with Qlik customization is that it is solely dependent on the user requirements and requires a strong understanding of those requirements and their specifics. Multiple skills are required to customize Qlik – including JS, Qlik and D3. In addition, performance and properties supported can be limited since Qlik may not support certain properties for external objects.
Goal
The approach is primarily targeted at the specific customer requirements or changes that are not provided in the Qlik Sense tool. The primary requests of Qlik customization are for visual enhancements, including changes in the design template or layout look and feel, and additional custom objects (additional charts not present as a Qlik Sense object to be incorporated in the dashboard).
Use Case
Why would one need to customize Qlik Sense? The Qlik Sense tool provides many charts and analytical properties but often a user needs more to enhance the existing chart or to add something new to catch the eye. For example, one might need to create a dashboard with a provided UX wireframe design and customized template to match the wireframe requirement. Or, one might need to integrate the Qlik objects as well as the external objects in a dashboard to achieve inherent Qlik properties for external integrated charts.
Solution Approach Scope
The requirement is for a layout template based on a wireframe UX design. Tasks include:
- Create a dashboard template from the wireframe design
- Analyze different objects on the wireframe and determine the requirements for the custom objects
- Use Qlik Sense API to develop the inherent Qlik Sense properties for the custom objects
- Use Qlik Mashup to integrate the existing Qlik Sense objects and the custom objects
Proposed Architecture
The proposed architecture will integrate with existing Qlik objects, Qlik extensions and external D3 and Canvas charts in a Qlik Sense mashup to create the dashboard as per the wireframe design. The exposed Qlik Sense API will be used to develop the inherent Qlik properties for the custom external objects. Required skills for the execution are:
- JavaScript – D3 charts, Angular JS
- HTML , CSS
- Qlik Sense mashup and API
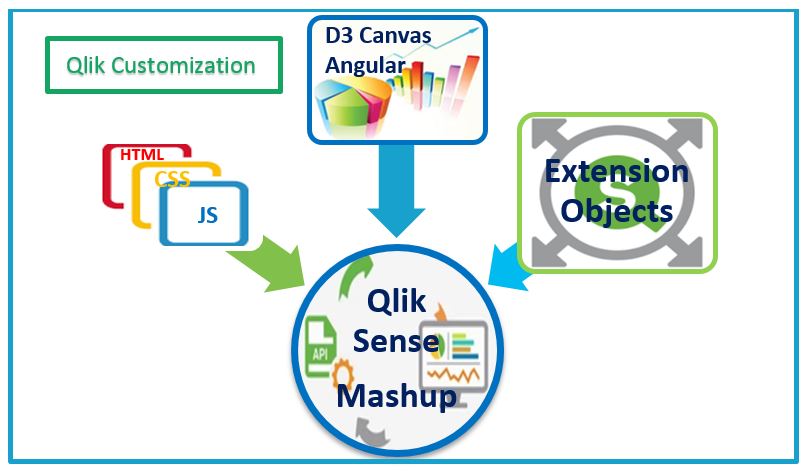 Figure 1: Qlik Customization Design
Execution Steps
Qlik customization includes various customizations such as building Qlik Sense custom objects. Extension object properties are also used to create custom filters, to create bookmarks, export to excel and download a snapshot of a Qlik object. These are apart from basic functionalities such as maximizing any particular Qlik object and a button to clear all the currently applied selections on the dashboard. The following are steps taken for the dashboard design:
- Freeze the wireframe design
- Analyze the components
- Create the dashboard template
- Build custom objects
- Use Qlik Sense API for the properties of the custom objects
Step 1: Freeze the wireframe design
The following figure shows the wireframe for Qlik Customization Dashboard.
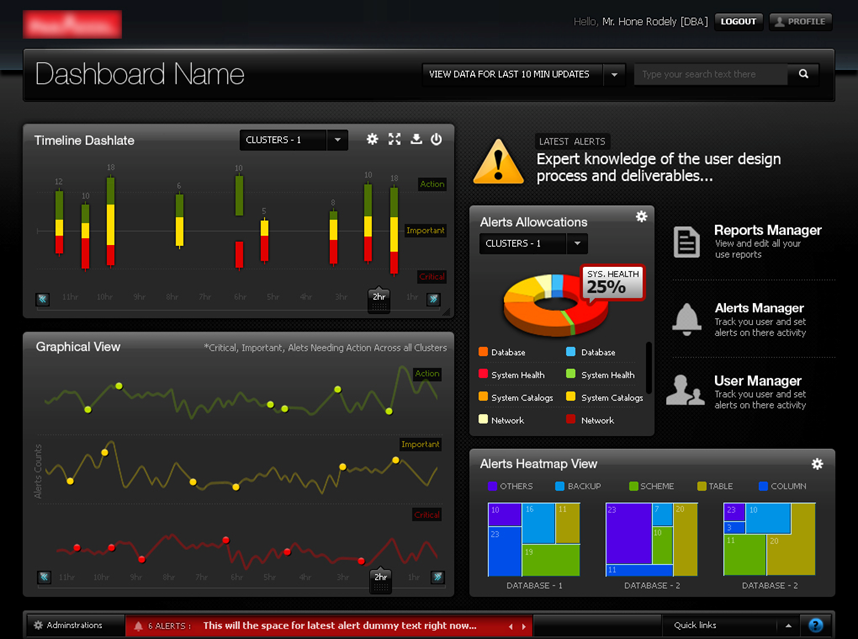 Figure 2: Wireframe for Qlik Customization Dashboard
Step 2: Analyze the components
Analysis of the wireframe was done to decide on the different components in dashboard. Sample sales data is used for the requirement. After analysis, we decided on the following components:
- HTML template for the dashboard layout
- Custom extension objects for the candle and the donut charts
- Modified inbuilt Qlik objects for the line chart and the heat map
Step 3: Create the dashboard template
The dashboard template is created in HTML using the Qlik Sense mashup. A layout template was created on which the chart objects were further placed. The screenshot below includes three customized Qlik sense objects:
- Candle chart: This chart has one dimension and three measures and is created using the d3JS library.
- Doughnut chart: This chart has one dimension and one measure and is created using D3Js library.
- Multi-line chart: This chart has one dimension and can have multiple measures. It is created using the D3Js library.
All three visualizations are interactive with each other and include an informative tooltip. The candle chart also has an interactive legend. As shown in the figure below, any D3 or other charts can be integrated in Qlik to create a customized template or charts based on the user requirement.
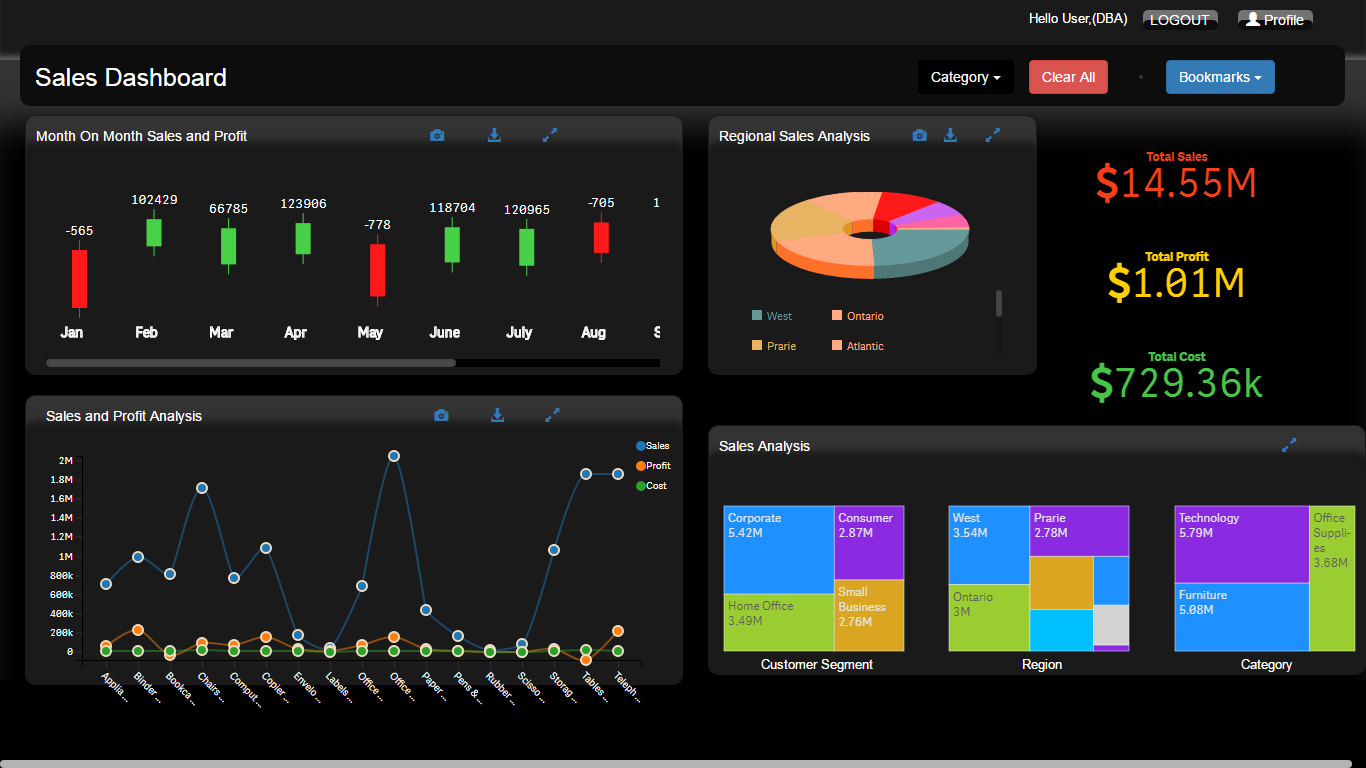 Figure 3: Customized Dashboard Based on Wireframe
Step 4: Build custom objects
Qlik customization is a Qlik Sense mashup. The type of the mashup is a basic mashup template with absolute positioning. The Qlik customization mashup has the following file structure:
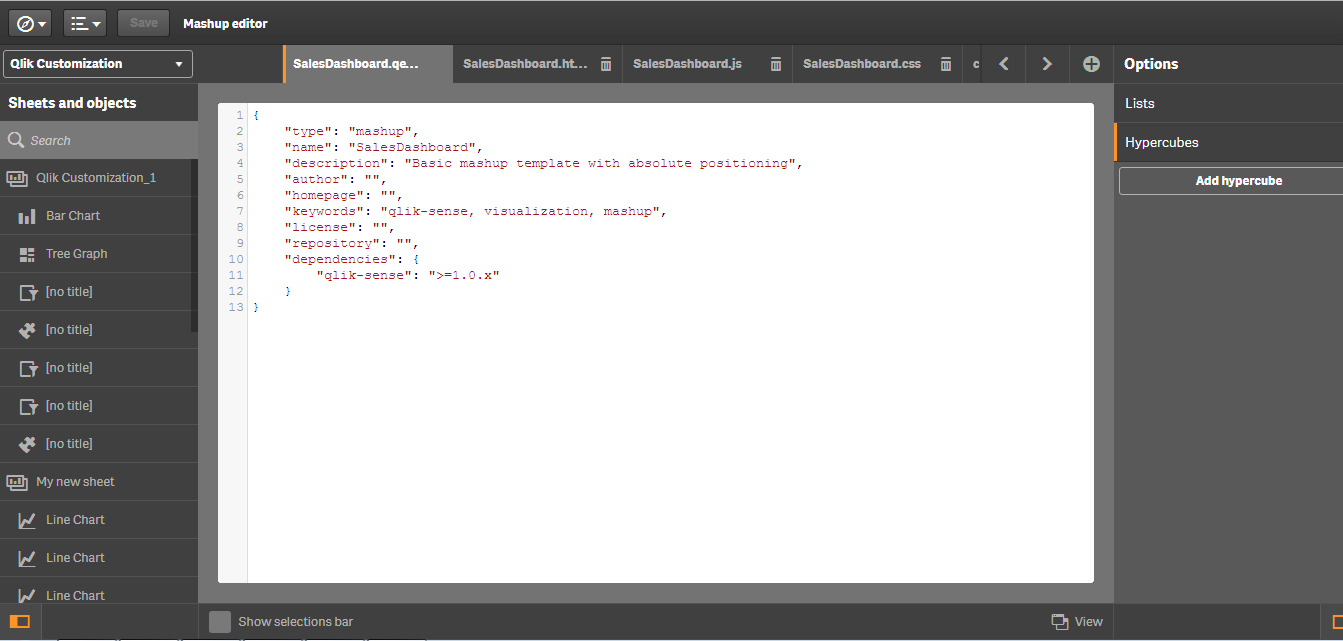 Figure 4: Qlik Sense Mashup
Each file has a specific purpose as described:
- qext: This file describes the mashup and includes parameters such as name, description, type, author, license, repository, dependencies, etc.
- html: This file includes the code for designing the mashup layout.
- js: This file holds a reference to the Qlik Sense report and the objects used in the report. It also includes the logic for custom filters, export to Excel, snapshot option and bookmarks.
- css: This file includes all the formatting related changes to the mashup.
Step 5: Use Qlik Sense API for the properties of the custom objects
The inherent Qlik Sense properties that were achieved for the customized Qlik Sense dashboard were custom filters, export to Excel, snapshot option and bookmarks. The basic template of the JS file is as follows:
define(["jquery", "./d3.min"], function($, cssContent) {'use strict';

$("<style>").html(cssContent).appendTo("head");

return {

initialProperties : {

// code for setting basic configurations goes here

},

definition : {

// declaration of number of dimension and measures goes here

},

snapshot : {

canTakeSnapshot : true

},

paint : function($element, layout) {

// code for creating the chart object goes here

}

};

});
The Qlik Sense custom object is a package, which includes various configuration files:
- JavaScript file: This file includes the actual logic to create the chart object. Various parameters can be set, such as number of dimensions and measures, export to Excel, snapshot of object, etc.
- qText file: This file describes the Qlik Sense object and it includes parameters such as name, description, icon, type, version, author, etc.
In addition to above files, one also choose to have CSS, HTML and/or JS files based on the requirement.
Custom filters
The custom filters are created using the ‘create list’ mashup API. These filters are like basic filters that allow the user to filter data based on the value selected in filter list. Code template:
$("#drpDwnCluster").html(prodFilter1);

app.field("Product Category").selectMatch(prodFilter,true);
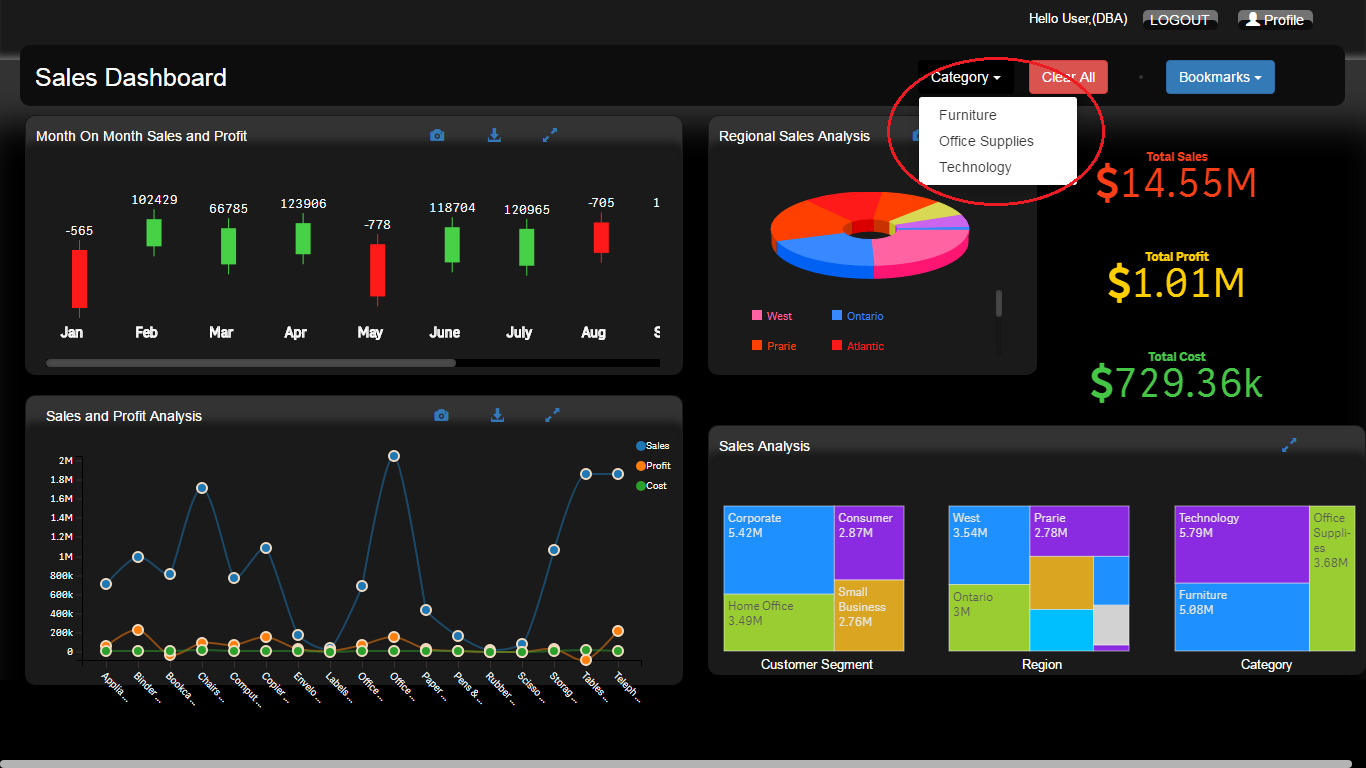 Figure 5: Custom Filters
Export to Excel
This feature allows the user to download Qlik sense object data into an Excel sheet. This is implemented using existing APIs exposed by Qlik. Code template:
vizModel.exportData().then(function(reply) {

window.open(reply.result.qUrl);});
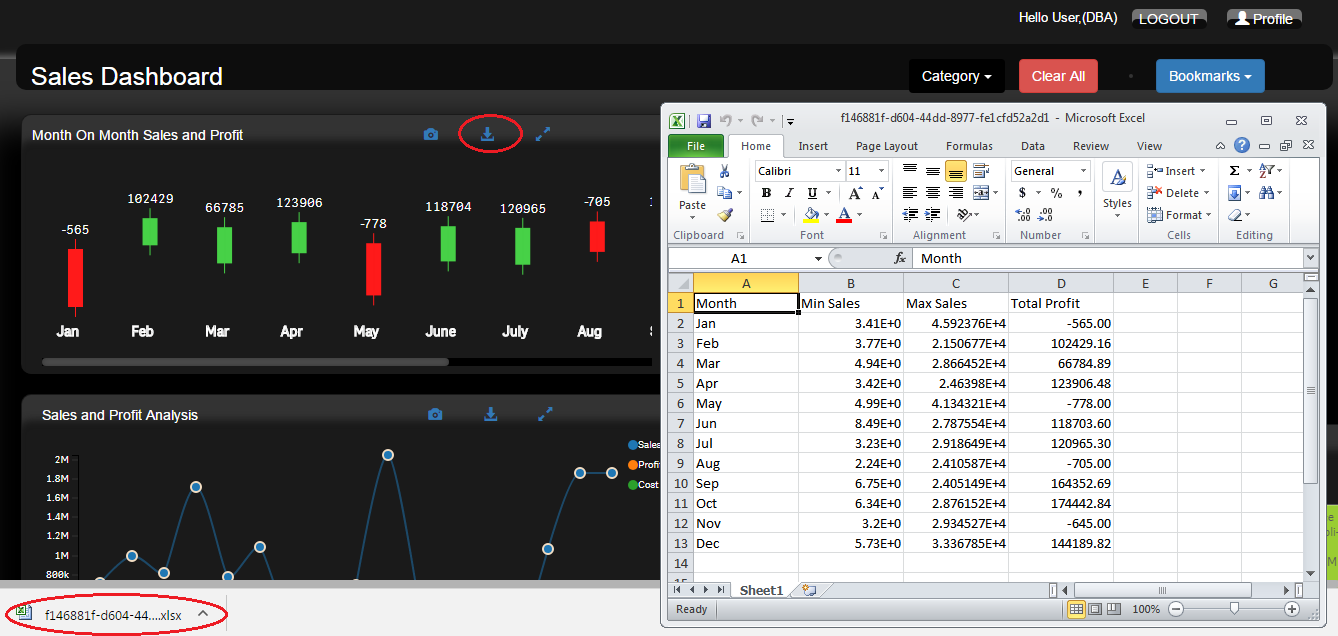 Figure 6: Export to Excel
Snapshot option
This feature allows the user to download a snapshot of the individual Qlik Sense object into .JPG format. In this way the user can download the current status of the Qlik Sense object (with or without selections applied to the dashboard) into the image format. Code template:
Referring qBlob file in mashup file:

require( ["js/qlik", "./qBlob/qBlob.js"], function ( qlik, qBlob ) {

});

Function to save snapshot of object:

qBlob.saveToFile(<objId>, <output filename>);
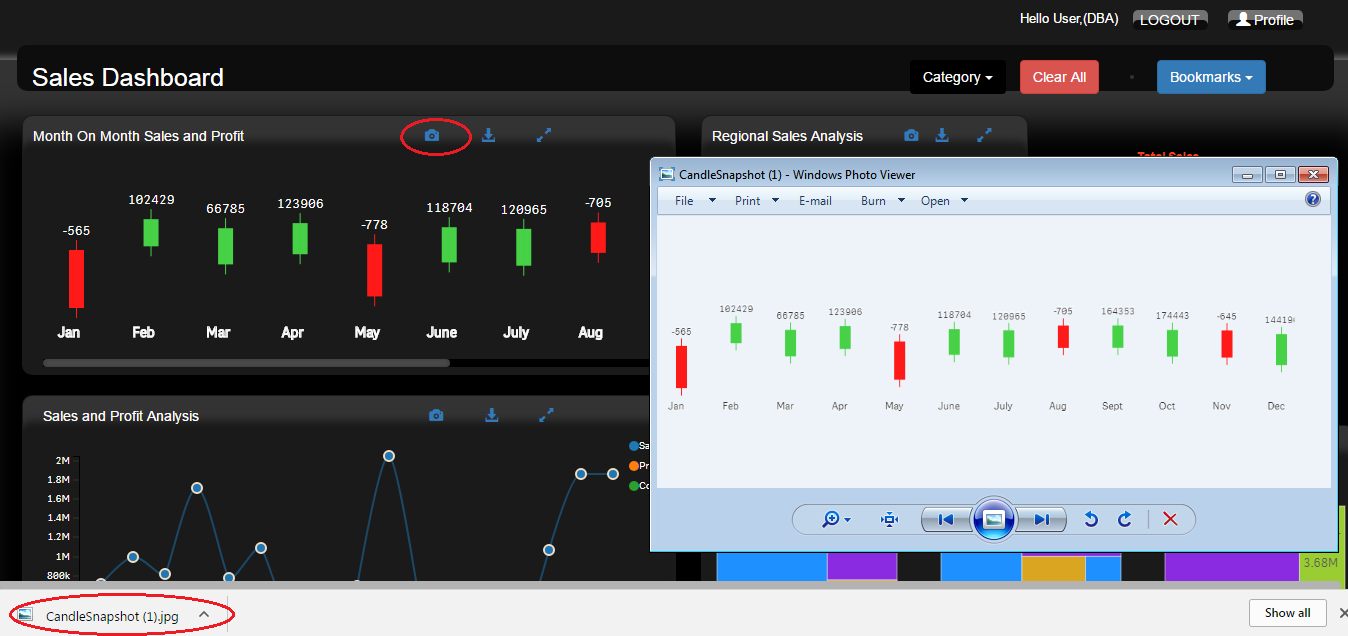 Figure 7: Snapshot Option
Bookmarks
This feature enables the user to save any particular state of the dashboard for viewing later as needed. Code template:
Function to get bookmark list: app.getList( "BookmarkList", function ( reply ) {

reply.qBookmarkList.qItems.forEach( function ( value ) {}

});

Function to create bookmark:

app.bookmark.create( title, desc );
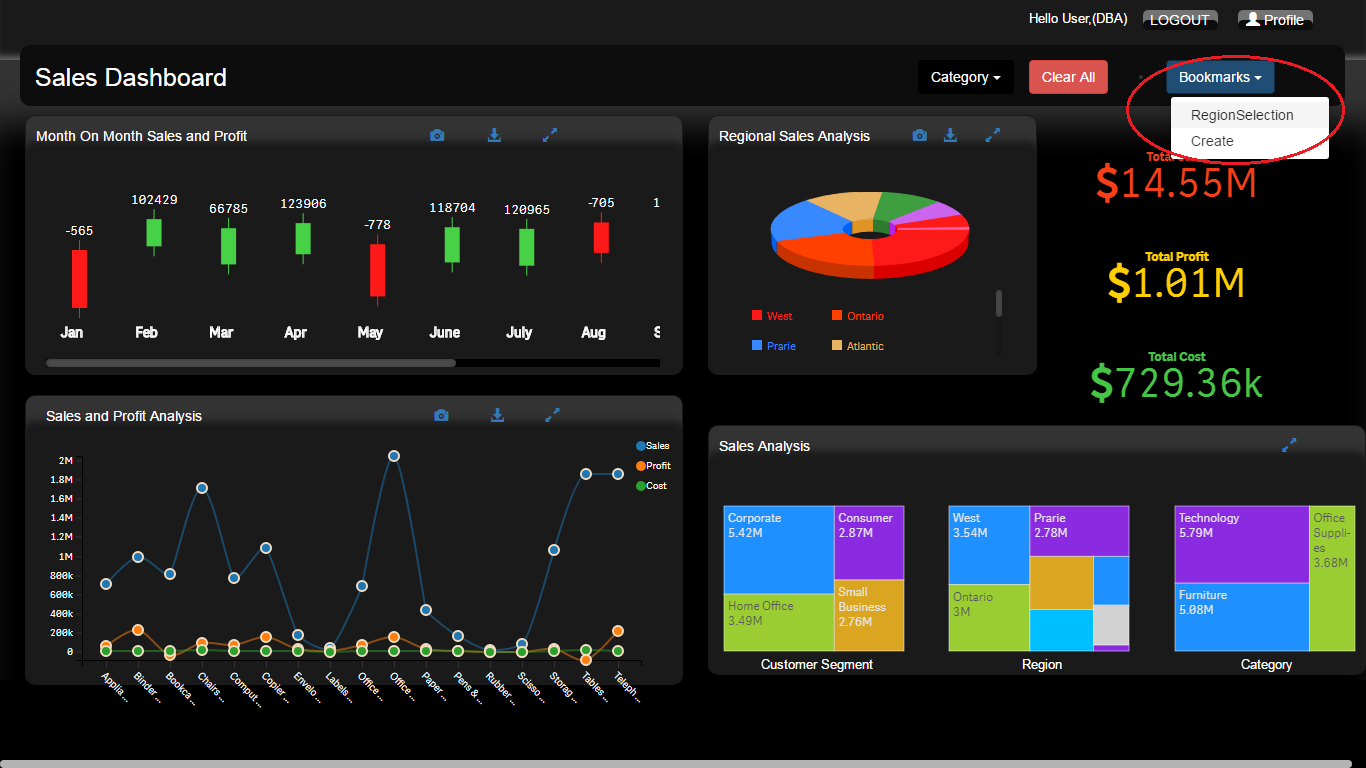 Figure 8: Bookmarks
Conclusion
Qlik Sense customization capabilities were explored by integrating different charts in D3 and other JavaScript libraries to create the required dashboard. Customization is highly user-oriented and depends on what the client requires. This solution showcases the capabilities to customize the layout, creating new charts as extension objects and developing inherent properties for the custom Qlik objects.


Get Started


