
Blog
Unleashing the Power of MicroStrategy!


One of the very interesting tools for BI is MicroStrategy Analytics by MicroStrategy Inc. It is one of the leading players in the BI Market and has presence all across the globe. MicroStrategy Analytics is BI and Predictive analytics software. It enables user to perform analytics on big data from different data sources like data warehouse, Excel files, and Hadoop distribution.
MicroStrategy Analytics come in 3 flavors:
- Analytics Desktop: Free version
- Analytics Express: A cloud based SaaS. Free for first 1 year
- Analytics Enterprise: Comes with additional features and with license fees
Visual Insight is part of all the 3 flavors and it’s a data visualization tool. MicroStrategy can be deployed in Companies data center or can be hosted on cloud. MicroStrategy Mobile is a software platform that enables customers to view analytics on most of the popular mobile platforms.
Let’s look at some of the Visuals which MicroStrategy can create:
Sample Charts:
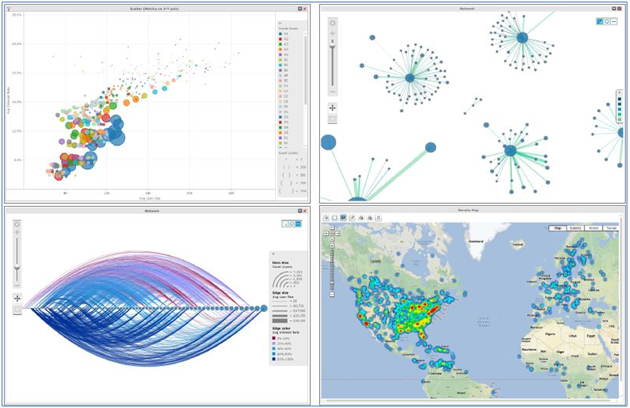 Charts
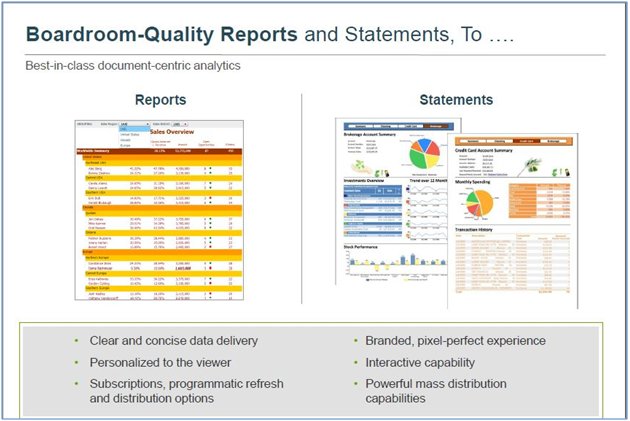
Sample Dashboards:
 MicroStrategy Dashboards
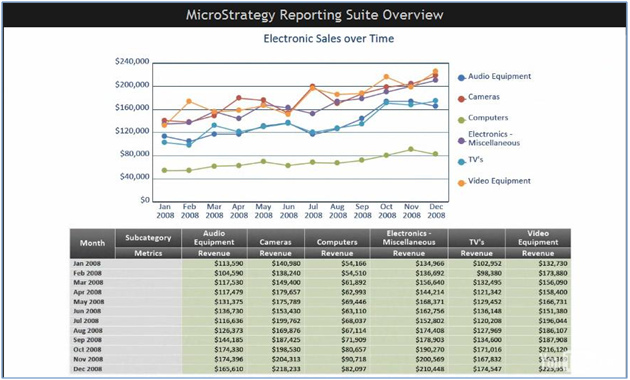
Report templates:
 MicroStrategy Reports
Getting the feel of MicroStrategy Interface:
Sample Home screen:
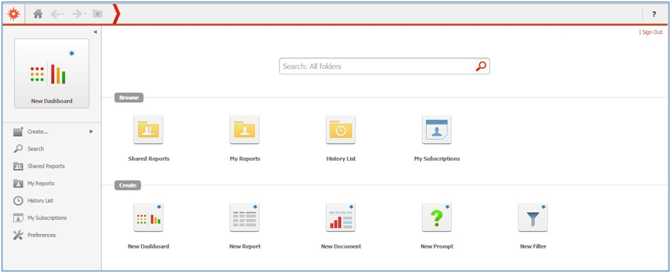 MicroStrategy Homescreen
MicroStrategy, as any other tool requires users to log in and access the reports they are authorized to view. The login screen is what will be displayed as the starting point for accessing reports.
MicroStrategy enables users to create their own customized reports and define the scope of report visibility. Users can create their own dashboards or reports and save them in ‘My Reports’ sections to access them later. However these reports cannot be shared.
For publishing a report and to make the report accessible by multiple authorized users, reports are stored in Shared folders. In shared folders users can create their own folder hierarchy and save reports. Also reports can be shared as links or through emails.
To generate and view the reports, user will have to navigate to the last level of folder hierarchy where the report resides and select a particular time period to run the report as per the criteria defined.
MicroStrategy can generate a GRID or Graph for reports.
Sample Grid and Graph:
 MicroStrategy Grids And Graphs
You can try your hands on creating some dashboards using MicroStrategy Visual insight free trial. You just need to sign up with your email id and activate the link to log in.
The final word:
We have seen how MicroStrategy tool is a very easy tool for implementing the Business requirements and get an insight of where you and your enterprise is heading.
I am sure by now all my readers have realized how MicroStrategy tool can help you evaluate where you need to focus if you need to build a competitive and long sustaining business enterprise. It is worth the effort and money, as tapping your customers and their needs is penultimate to success!!


Get Started


