
Blog
Strategize Better with Data Visualizations using Tableau BI Dashboards
Blog
Strategize Better with Data Visualizations using Tableau BI Dashboards


By 2022, more than 50% of major new business systems will integrate continuous intelligence that uses real-time context data to improve decisions, says Gartner.
From basic graphs to dynamic visual analytics, Business Intelligence (BI) has evolved over the years. Today, BI data visualizations available through suitable integrations with business processes enable data-driven decision-making for enterprise users. There are time and cost benefits when business users do not have to seek analysts or IT support for information needs. Since years, Tableau business dashboards have been empowering business stakeholders to manage risks and strategize with speedy insights across data points.
Data visualization is a key component of BI. The other components include data mining, business analytics, data tools, etc. With modern data visualization solutions, enterprises get the flexibility to use static and dynamic graphical elements representing real-time data insights for enterprise reporting needs. In this blog, we will talk about enterprise reporting challenges and the ways to solve those challenges by leveraging the data visualization capabilities of solutions like Tableau.
Self-service analytics for business end-users
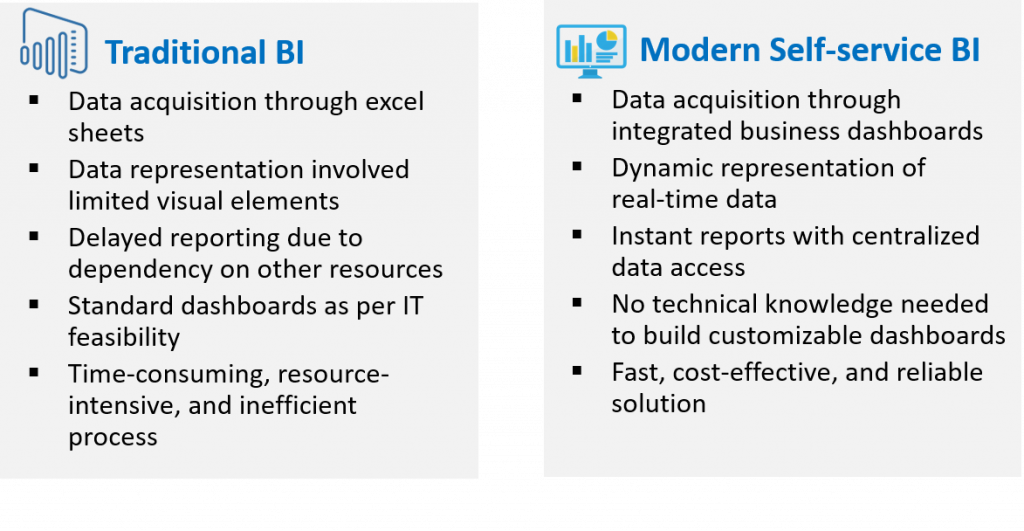
An important concept you may come across in the BI space is SSBI. So, what is Self-service Business Intelligence (SSBI) and how does it help enterprise users? Self-service Business Intelligence (SSBI) is a trend wherein business users can manage their BI tasks on their own without the support of IT.
With SSBI tools, business users do not have to rush to analysts for data gathering or the IT team for tech support with dashboard creation. An enormous amount of time can be saved with quick access to data and insights with a solution such as the Tableau business dashboard, which supports SSBI. The user does not need any specialized IT capabilities to get integrated data from excel files or other database formats from various departments.
By upgrading the existing legacy reporting framework to modern visual solutions like Tableau, enterprises can improve time-to-market. To upgrade from siloed systems, technology partners can create a data lake to store relational data for building a standardized information delivery system for an enterprise. Integrating the sources with a BI solution solves the challenge of building different dashboards for various business functions.
Looking into enterprise reporting challenges
Roadblocks in enterprise reporting arise when:
- Senior leaders are unable to make critical decisions due to lack of access to consolidated information about the performance of their various business units.
- Creating customizable dashboards for different business users or modifying it with changing business needs may not be feasible for an enterprise. A flexible dashboard creation solution becomes the need of the day.
- Business users struggle as there is lack of data reliability due to siloed data across business functions.
- Dashboards for handheld devices is not available to update real-time data by field staff or production floor staff
- Delays affect customer experience due to the unavailability of standardized data
Choosing the right business visualization solution
There are several data visualization solutions with powerful features available today. Power BI is entirely cloud-based. SSBI features are better in other available solutions than Qlik Sense. The sophisticated Tableau dashboards are user-friendly and can be installed on-premise. As business challenges vary from one organization to another, the data visualization solution is chosen based on various factors such as data quality, cost, capabilities, integration needs, and customizations. The ROI is also evaluated before zeroing in on a particular solution.
SQL Server Integration Service, Microsoft Azure Data Factory, Oracle Data Integration Platform, and Talent Open Studio are the popular ETL tools used by developers for data consolidation. Poor data quality is one of the major challenges faced by developers while creating analytics dashboards. As per the case, data cleansing techniques are used to clean data.
Here are a few scenarios where experts chose a specific data visualization solution based on client needs:
Scenario 1:
A business struggling with dispersed information from multiple sources needed a solution to identify the single source of truth. Experts solved the problem by creating a data mart on top of Master Data Management (MDM) to offer purpose-driven dashboards and capabilities. From a technical perspective, integration with Qlik View seemed apt for business dashboard requirements.
Scenario 2:
To create an end-to-end reporting solution using the existing excel reports of a leading pharma company, experts implemented ETL for data consolidation. The user-friendly Tableau dashboards were implemented for enhancing the reporting experience. BI experts developed authenticated dashboards for specific business users too.
Scenario 3:
For a meat company, mobile dashboards were needed with IoT Data. In this case, experts used Power BI with Machine Learning algorithms to display the required output on mobile dashboards.
Features of Tableau and other data visualization solutions
Data visualization capabilities can give businesses an integrated reporting platform wherein actionable insights can be accessed seamlessly. A comprehensive performance monitoring, analysis and reporting tool makes resource utilization and strategy-building exercises easier. Online Analytical Programming (OLAP) features are present in leading BI solutions such as Tableau, Power BI, and Qlik Sense for performing deep analysis of data.
As per the business requirement, a solution can be designed with focused KPIs developed with drill up/down feature for easy navigation of data hierarchies. Modern BI solutions also enable users to perform ad-hoc analysis for quick reporting needs. For creating tailored BI solutions, data experts can integrate custom visualization plugin, dashboard object customization, and domain-specific charts using JavaScript libraries.
So, why use Tableau? Tableau enables visual storytelling using elements such as Scatter Plot, Gantt Chart, Heat Map, Tree Map, etc. The latest Tableau 2020.1 version is feature-packed with visual analytics, data management, IT management and IT governance capabilities for enterprises. Also, the time and effort required to get a custom dashboard designed can be eliminated with the simple tools available on Tableau.
Benefits of Tableau business dashboards
As per a Gartner survey, 64% of organizations consider enterprise reporting and dashboards their most business-critical applications for data and analytics.

Modernizing enterprise reporting with visual analytics enables businesses with capabilities that increase the productivity of business users.Tableau provides user-friendly capabilities for data extraction, data visualization, data analysis, and report creation. With data synchronization across devices for Tableau dashboards, data monitoring and report distribution is achievable on the move.
BI tools can improve business response to client issues and enhance the customer experience as well. For Tableau users, once the dashboard is created, it can be published on the Tableau Server allowing other business users to access the dashboard securely for further action. Also, live Tableau dashboards can be accessed online or embedded in web pages as required.
Xoriant’s expertise in data visualization
A global leader in network services needed support with modernizing their legacy reporting system. The business users of the client’s existing reporting system were struggling to make decisions due to lack of BI and siloed data. Our experts designed a robust enterprise reporting system using AWS cloud-based data lake and Tableau, which enabled the client with seamless access to unified business insights.

As per 2020 Data Analytics trends by TDWI, the future will be about organizations controlling and managing the data value chain with streamlining of insights and actions. BI solutions with high-end data visualization capabilities are enabling enterprises to streamline reporting for data-driven decision-making.
Connect with experts at Xoriant to know more about the implementation of Tableau and other modern data visualization solutions for enterprises.
References
Gartner.com-gartner-survey-shows-organizations-are-slow-to-advance-in-data-and-analytics


