
Blog
LeafletJS: A New Dimension in Maps API


Leaflet is an open-source, fast moving, light weighted java script library for mobile friendly interactive maps. This library is aimed for simple and performance oriented usage, according to Vladimir Agafonkin. Leaflet developers follow simple and small collection of libraries to take the load on mobile devices. Because of this, open source LeafletJS has been one of the most famous API’s amongst the mobile application developers.
Significant features of LeafletJS are:
- Lightweight of around 34 KB of gzipped JS code
- GeoJSON Layers, Markers (provision of custom markers) and Pop-ups, Pure CSS3 pop-ups and controls (easy designing and animation)
- Use with other map Providers (Google, OSM and MapBox)
- Browser Support works in IE7 and Vector layers, Raster layers, Image Layers, WMS Layers, Layer Groups, Scroll wheel zoom, Double click zoom, Zoom to area (shift-drag), Keyboard navigation features
Benefits of using LeafletJS:
- Simple, fast and reusable code
- No external dependencies, Tile layers and drag panning with inertia and Multi-touch support
- Very nice default design for popups, markers, layers and other map controls, tile layers and markers are well supported with retina resolutions
- js 1.0 collaborates with Leaflet to support embedded maps
Now let’s start with LeafletJS:
Let’s now understand how we can write a code to display the simple functionalities of a map.
1.Build the boilerplate Leaflet map and create coordinates in the data file:
Download Leaflet from LeafletJS.com. The source code is available on GitHub. Github.com Its terms and conditions for using LeafletJS open-source license can be combined with any site without legal apprehensions. LeafletJS allows us to use wide range of base maps tiles, we need to add these tiles for using the LeafletJS function.
Code snippet:
var layers = [
L.tileLayer( 'http://{s}.mqcdn.com/tiles/1.0.0/map/{z}/{x}/{y}.png', {
attribution: '© <a href="http://osm.org/copyright" title="OpenStreetMap"
target="_blank">OpenStreetMap</a> contributors | Tiles Courtesy of <a
href="http://www.mapquest.com/" title="MapQuest" target="_blank">MapQuest</a> <img
src="http://developer.mapquest.com/content/osm/mq_logo.png" width="16" height="16">',
subdomains: ['otile1','otile2','otile3','otile4']
})
];
var layerGroup = L.layerGroup().addTo(map);
for ( var i=0; i < layers.length; ++i ) {
layerGroup.addLayer(layers[i]);
}
Now, we can add few markers to the map so as to create GeoJSON data or file with marker details. In this example, we have created a markers GeoJSON data.
Code snippet:
markers = [
{
"name": "Canada",
"url": "https://en.wikipedia.org/wiki/Canada",
"lat": 56.130366,
"lng": -106.346771,
"emergencyLanding": true,
“airportType”: “I”
},
{
"name": "Barbados",
"url": "https://en.wikipedia.org/wiki/Barbados",
"lat": 13.193887,
"lng": -59.543198,
"emergencyLanding": true,
“airportType”: “D”
}];
Map with data markers would look similar to the diagram shown below.
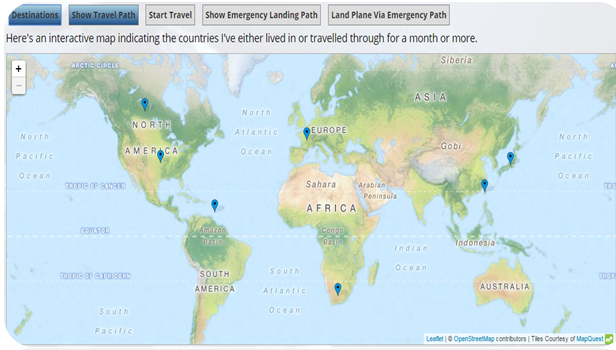 Map with Data Markers
2. How to read data from jSON objects or file:
We are generally more interested in loading the data from the file and code snippet, below is an example of the same:
Code snippet:
for ( var i=0; i < markers.length; ++i )
{
var latlngs = [markers[i].lat, markers[i].lng];
var marker = L.marker( latlngs , {icon: markerIcon} )
.bindPopup( '<a href="' + markers[i].url + '" target="_blank">' + 'Route Point ' + (i+1) +
  Place: " + markers[i].name + "  <br/> Lat: "  + markers[i].lat + " Lng: "  +
markers[i].lng  + '</a>' )
.addTo( map );
mapAddedObjects.push(marker);
}
Now, we will manually set the zoom level and view the map level center through programming. We can also add our markers to the map and create a GeoJSON layer from our data using the GeoJSON method.
3. Filtering out data:
Many a times we look for subsets of markers that allow the user to turn on and off based on the requirements. For example let’s use international vs domestic airports. The GeoJSON method in LeafletJS has a filter option to bifurcate the data into different types of airports. Post that we can insert the individual filtered data to the map as and when required.
Code snippet:
var interNationalAirports = L.geoJSon(data,
{ filter: function(feature, layer) {
return feature.properties.AirportType = "I";
}
});
var domesticAirports = L.geoJSon(data,
{ filter: function(feature, layer) {
return feature.properties.AirportType = "D";
}
});
And then we can insert our filtered points using addTo(map):
// International Airports
interNationalAirports.addTo(map);
// Domestic Airports
domesticAirports.addTo(map);
As of now map remains the same.
4. Different icons plotted for different types of points:
The generic method of changing icons in LeafletJS is a complex process, but there is also a simpler method with the usage of plugin provided by Lennard Voogdt. Leaflet.awesome-markers plugin provides us a way to color code our markers and to glyphs from bootstraps.
Code snippet:
var markerIcon = L.icon({
iconUrl: myURL + 'images/pin24.png',
iconRetinaUrl: myURL + 'images/pin48.png',
iconSize: [29, 24],
iconAnchor: [9, 21],
popupAnchor: [0, -14]
});
var planeIcon = L.icon({
iconUrl: 'https://www.mapbox.com/maki/renders/airport-24@2x.png',
iconSize: [24, 24]
});
var landingIcon = L.icon({
iconUrl: myURL + 'images/landing_giphy.gif',
iconSize: [24, 24]
});
In this example, we are showing different icons for destination points, plane and emergency landing. There are two parts in this: First, we create the required icon and second, we glue it on the required layer.
Code snippet:
if(travelMarker) {
map.removeLayer(travelMarker);
}
if (L.polyline(1)) {
map.removeLayer(L.polyline(1));
}
travelMarker = L.marker( [markers[index].lat, markers[index].lng] , {icon: planeIcon
,rotationAngle: 60}  ).addTo( map );
mapAddedObjects.push(travelMarker);
5. The final output of the Application:
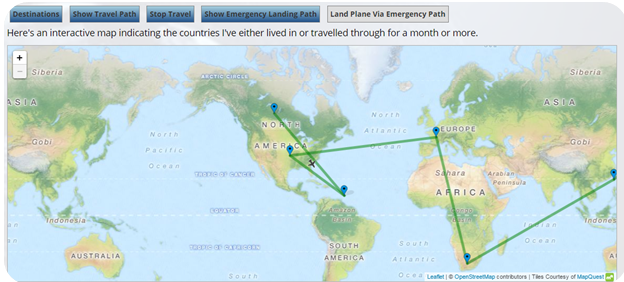 Final Output Map
More LeafletJS – Plug-ins
MarkersClustererMiniMapHeatMap WebGL
The best thing in Leaflet is the basic map library and ability to work with many other plug-ins that are available in the market. This open-source plug-in community gives us the assurance of making the maps more extensible, pluggable and elastic without disturbing the core of LeafletJS libraries.
MapBox.js 1.0 collaborates with Leaflet:
MapBox.js is now version 1.0 making it one of the most recognized and strong open source mapping libraries. With the help of MapBox.js, it would be easier to embed the map with web and mobile application. We can also blend the powerful features of LeafletJS and multi-platform compatibility. It continues to support the most frequent native vector layers with a fine combination of tile and vector statistics.
Conclusion:
Leaflet is a new technology in the market competing with full-fledged Google Maps and OpenLayer API. Leaflet, Google Maps and Open Layer can probably manage 80% of the web mapping applications that are commonly required, but the two main parameters, lightweight and portability to mobile and web application, would be the driving factors that Leaflet is adding new dimension in Maps API.


Get Started


