Xoriant Visualization (XViz) Framework

Table of Content
XViz OVERVIEW
Xoriant has been involved in developing multidimensional, interactive D3.js visualizations for a number of its clients. The knowledge and experience gained by our engagement team and technical personnel has led to the development of Xoriant Visualization (XViz) framework.
Xoriant Visualization (XViz) framework is a JavaScript framework that is built over D3.js using Twitter Bootstrap and Angular JS. The framework in itself is multi-platform compatible in that, it can be deployed across multiple hardware platforms like Android phones, tablets, Apple devices like iPads, iPhones and iPods.
Xoriant’s proprietary XViz Framework is developed to create and deploy complex data visualizations on any device (handheld or otherwise) supporting a web browser or a web view.

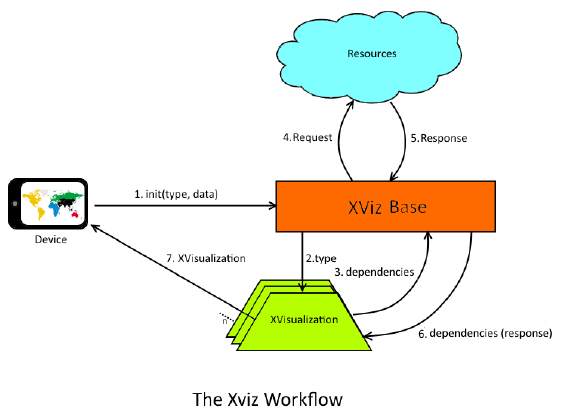
The XViz framework comprises of multiple independent modules used for preloading of files and data required for visualizations, data parsing, view rendering and communication between visualizations as well as communication between visualizations and native device code. Visualizations developed using the XViz framework are independent in that they can be deployed by themselves wherever they are required and do not depend upon the existence/inclusion of other visualizations.
XViz KEY FEATURES
- Converts thousands of lines and MBs of data into visualizations that can be viewed at a single glance
- Developed using open source free technology
- Runs on web technology therefore available on all platforms that support web browsers
- Supports extensibility so that visualizations can utilize functionality that is already deployed
XViz KEY BENEFITS
- Built keeping plug-and-play in mind which means visualizations can be added by including a single script file
- Already developed out of the box common components reduce visualization development time by 30%
- Reduces Time to market
- Data can be preloaded or streamed based on requirements or device capabilities


