
Blog
Use Gatling to Measure & Analyze Performance of Web Applications
Blog
Use Gatling to Measure & Analyze Performance of Web Applications


There are various load test tools available in the market, and today we will see features, benefits and implementation of Gatling tool which is a hidden treasure.In this blog we will learn about the basic overview of Gatling i.e a complete process from recording a scenario to analyze reports.
Gatling is an open source load testing tool for analyzing and measuring the performance of a variety of services, with a focus on web applications. It uses the actor model which consists in asynchronous parallel computing. The Actor implementation used in Gatling is Akka. In Gatling, scenarios are represented as easy-to-maintain scripts with a DSL (Domain Specific Language), written in Scala.
Key Features of Gatling:
- DSL for simulation to treat performance as a code
- Produces higher load by using an asynchronous non-blocking approach
- Full support of HTTP(S) protocols
- Supports input files CSV, TSV, SSV to access random data for data-driven tests.
- Generation of graphical reports using Graphite
Benefits of using Gatling:
- All reports and graphs are generated automatically in HTML after successful execution
- It is able to sustain high concurrent load with no obvious degradation in response times at 20K users
- It gives more accurate results with less memory and CPU usage
- It can run on any operating system
Gatling Architecture
Gatling architecture is divided into three parts
- Gatling Process involves mainly three steps Compilation, Execution and Reports generation.
- Gatling is divided in three projects – Gatling, Gatling VTD and Gatling High charts and 9 modules.
- API’s allow developers to add components and plugins in an easy way.
Gatling Process overview:
Record simulation using Gatling Recorder
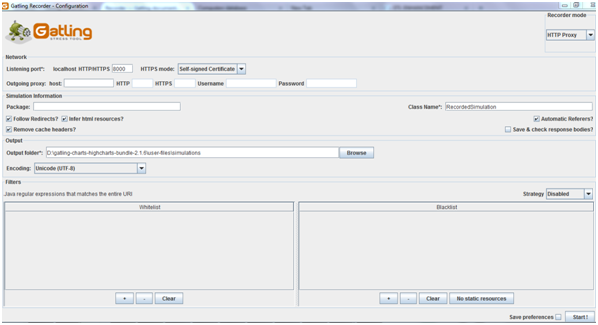
To record the scenarios we will use the Gatling Recorder which records all the actions performed on the web application. For this purpose we need to configure the browser to use Gatling recorder’s proxy. Gatling recorder tool is launched by running a batch file located in the bin directory. “gatling-charts-highcharts-bundle-2.1.6\bin”
Once launched, we get the configuration interface, which lets us configure how requests and response are recorded.
 Gatling Recorder
Launch the recorder:
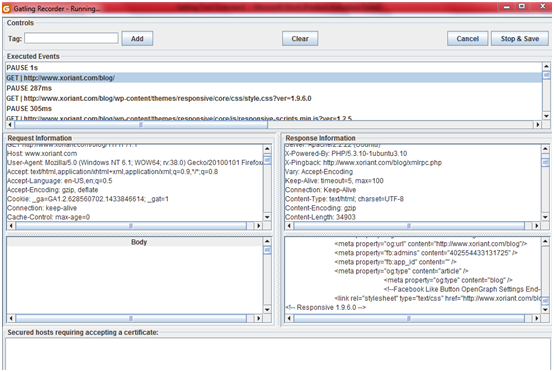
Once the configuration has been done click on the Startbutton to launch the recorder.
Three types of logged events:
- Tags: These are markers/comments that we can add by providing the comment in text field and clicking on Add button.
- Requests: The requests are sent by the browser, these are transferred by the recorder but only those passing through filters are shown in the list of events and are saved in the scenarios. When we click on a request, information about this request and its response are respectively shown in the "Request" and "Response" text areas located below the list of events. If the request contains a body, it will be displayed in the last text area labeled "Request Body".
- Pauses: The time between two requests logged by recorder is calculated automatically during the scenario.
The clear button removes all logged events. Stop and Save button saves the script in the mentioned path while configuring the recorder.
Record the scenario:
Now we will start recording the scenario as planned: When we are done with recording the scenario we will click on the Stop & Save button. Script will be saved on the folder mentioned during configuration of recorder.
Edit the Script:
We can find our script on the path gatling-charts-highcharts-2.0.0-M3a\user-files\simulations\Demo. Package is defined by the name we mentioned while configuration followed by import statement. Import statement allows referring the classes stored in other packages. Here it automatically refers to other inbuilt classes.
package demo
import scala.concurrent.duration._
import io.gatling.core.Predef._
import io.gatling.http.Predef._
import io.gatling.jdbc.Predef._
class RecordedSimulation11 extends Simulation {
val httpProtocol = http
.baseURL("https://www.xoriant.com")
.inferHtmlResources()
This scala file consists of different parts :
- The HTTP protocol configuration: This configuration is basic and just defines the base URL.
- The headers definition: All headers are declared in the beginning of the file and used in the scenario definition.
- The scenario definition: After headers definition scenario is defined with a scenario name which is editable. Scenario consists of two methods ‘exec’ and ‘pause’, to describe an action and to simulate the thinking time of the user between pages.
- The simulation definition: The last part of the file contains the simulation definition, where we define the load that we want to inject to the server ( Here we have defined it for one user only).
Increase the number of users:
Now we will update the simulation definition to simulate 100 users over 10 seconds.
setUp(scn.inject(rampUsers(100) over (10 seconds) ) ).protocols(httpProtocol)
We can also add feeders and checks in the scripts as per our requirement.
Feeders: these are used to inject data in the simulation for each user. For eg.
val userCredentials = csv("user_credentials.csv").queue
So from this csv file data will be injected into the simulation.
Checks: Checks are performed on a request to verify that the response to a request matches the expectation. For eg:
.exec( http("My Request").get("myUrl").check(status.is(200))).
Execute the simulation:
To run the script we need to run the Gatling batch file located in bin directory: \gatling-charts-highcharts-bundle-2.1.6\bin.
Select the simulation number from the list and press enter key. Now it asks for run description, it is optional and will create the simulation report folder with mentioned run description.
View and Analyze Results:
We can view the reports from \gatling-charts-highcharts-bundle-2.1.6\results path by viewing the index file in a web browser.
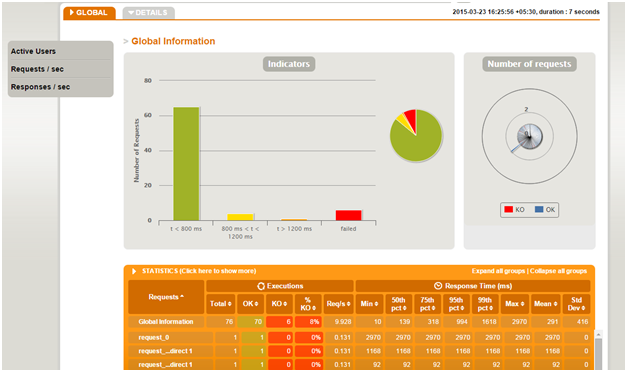
HTML Report contains two tabs. Global section is meant for consolidated statistics and all reports are for overall simulation. Details section is meant for request specific statistics. Reports under this section are available for each request. If user clicks on request then report for that specific request will be displayed.
Statistics section shows the statistics of all the requests executed with their response time and shows some standard statistics such as min, max, average and standard deviation.
 Gatling_Analyze_Records
Gatling provides us various useful reports like: Active users along the simulation, Response time distribution, Response time percentiles over time, Number of requests per second, Number of responses per second, Latency Percentiles over time, Response time over global RPS, Latency against Global RPS.
Conclusion:
This blog has provided a basic overview of Gatling tool. And we have seen how we can utilize the capabilities of this tool in terms of the performance of web-based applications, we can increase the number of virtual users and check the application response. Gatling’s easy to understand and its graphical reports feature helps us to find out performance issues quickly.
For further learning, you can refer to Gatling documentation which is available at: Gatling.io


Get Started


