
Blog
Burn Down Charts: A Way of Effective Sprint Management


Introduction
Burn-down charts are commonly used for sprint tracking by agile practitioners. The most effective and used method is plotting burn-down charts using efforts remaining versus remaining time to complete it, by doing so teams can manage their progress. At any point in a Sprint, the remaining efforts in the Sprint Backlog can be summed. The team tracks these remaining efforts for every Daily Scrum to showcase how to achieve Sprint Goal. The Product Owner calculates total work remaining at least in every Sprint Review. In sprint reviews work remaining is compared with this amount by Product Owner to check progress toward finishing the projected work by the desired time for the goal.
How To Create Burn-Down Chart
The very first step is to breakdown task to different sub-tasks. This is done during the sprint planning meeting. Each task should have working hours associated to it (ideally not more than 12, roughly two days' work at six per day), which the team agrees on during the planning meeting. Once the task breakdown is done, the ideal burn-down chart is plotted. This chart reflects progress considering that all tasks along with their sub-tasks are accomplished within the sprint at uniform rate (refer to the red line in below figure). Many Agile tools (JIRA, Rally, Mingle etc.) have built-in feature for burn-down charts. However, a burn-down chart can be plotted and maintained in a spreadsheet in its simplest form. Sprint Cycle (Dates) in the sprint is plotted on the X axis, while efforts remaining are plotted on the Y axis. Refer below example: Duration of Sprint – 2 weeks Size of Team - 7 Time (Hours/Day) – 6 Total Capacity to complete work – 420 hours On Day 1 of the sprint, once the task breakdown is in place, the ideal burn-down will be plotted as below: 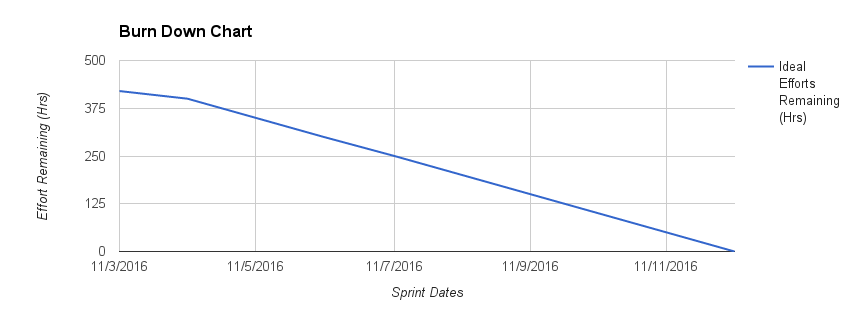 The Y axis depicts total hours in the sprint (420 hours), which should be achieved by the end of the sprint. Ideal progress is shown in the blue line, which assumes all tasks will be completed by the end of sprint.
How To Update Burn-Down Chart
Each member picks up tasks from the task breakdown and works on them. At the end of the day, they update effort remaining for the task, along with its status. Refer below example; the total evaluated effort for Task 1 is 10 hours. After spending 6hrs on the task, if the developer thinks he requires another 4hrs to complete, the "Effort Pending" section should be updated as 4. Requirements team have completed their task hence they have updated status as “Closed” and “Effort Spent” as 6. QA team has not yet started with their task hence status is “In-progress” and “Effort Pending” as 12. 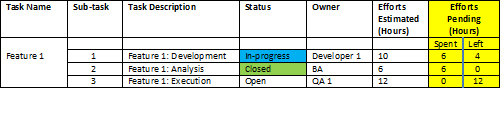 As we progress during the sprint, the burn-down will look like this:
 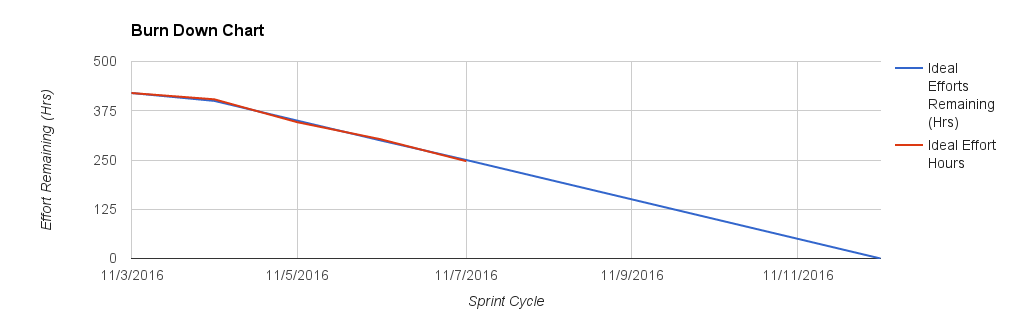 Sometimes, scrum teams are not able to predict efforts for sprints. Important aspect of the chart at the end of the day is that it should accurately reflect work remaining against required efforts to accomplish it with single team member updating it. Also, this can be discussed in daily scrum. For example: If team had initially broken a task into 3 sub-tasks without understanding the complexity and dependency then they have created a potential bottleneck situation. To tackle such instance team can re-visit efforts required and recalculate it to complete task at the end of day when they have started sprint or if they are in initial phase of sprint and update burn-down chart. Here team can consider adding a "Spike Task" of 2-3 days to understand the complexity (by taking KT sessions, revisiting references, and walkthrough from product owner or BA) and remove uncertainty around the task. They can thus add "follow on tasks" to the original estimate and recalculate efforts required for the sprint.
Understanding Burn-Down Chart
There are only two lines drawn in Burndown chart, but the situation they describe might have different reasons and meaning to it. If effort remaining is above the ideal effort hours, it means we are going at a slower pace and may not be able to finish all the commitments of the sprint decided during sprint meetings. If effort remaining is below the ideal effort hours, it shows that we are going at a better rate and may be able to finish earlier in the sprint. Below are different stages of scrum teams in a sprint and way to interpret it.
Sprint commitment MET
 Above progress is observed on charts of experienced agile teams. It indicates team is able to organize itself. The team has completed work on time and achieved sprint goal. The most important is they have great product owner who understands the reason for a locked sprint backlog and a great scrum master able to help the team. The team is not taking more work outside team’s capacity and velocity and finished the spring backlog on time. The team is also able to estimate capacity correctly.
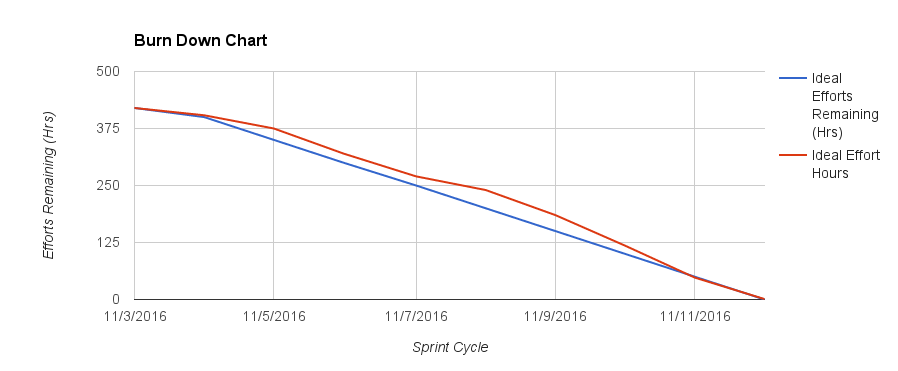
Sprint commitment NOT met
 This burndown chart says: "You have not completed your commitment". This progress is mostly observed in inexperienced agile team. The team has been late for the entire sprint. They did not adapt the sprint scope to appropriate level. It shows that the team has not completed stories that should have been split or moved to the next sprint. In such situation amount of work allocated in next sprint should be reduced. If this happens again, curative actions should be taken after a few days when progress is slow. Typically, less priority story should be pushed to the next sprint or back to the product backlog.
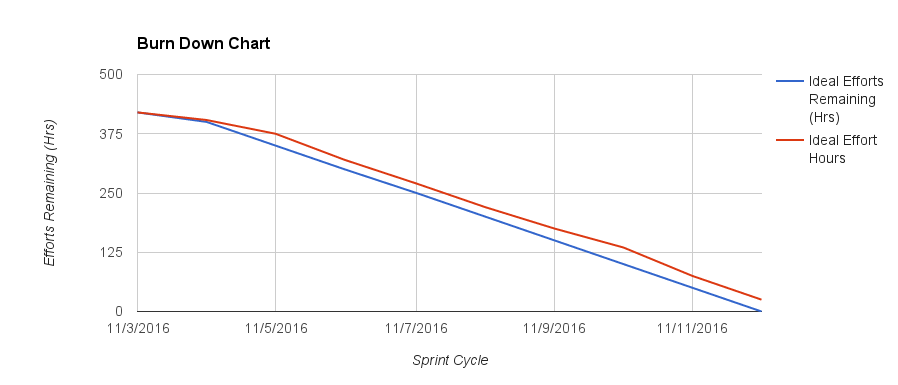
Team stretched towards end to meet the commitment
 This chart says that team started well in the first half of the sprint but later in middle of sprint team lost focus and worked at slower pace. At the end, team completed sprint on time by meeting sprint goals by stretching working hours. In retrospection, team should discuss the reasons of late progress in the first half of the sprint and solve issues so they are better positioned in the coming sprint. Team should also consider the capacity of task they are able to complete in one sprint.
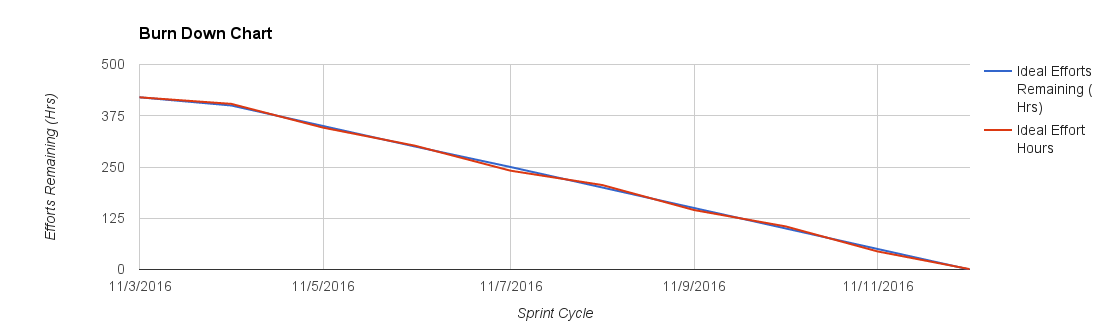
Team is not consistent
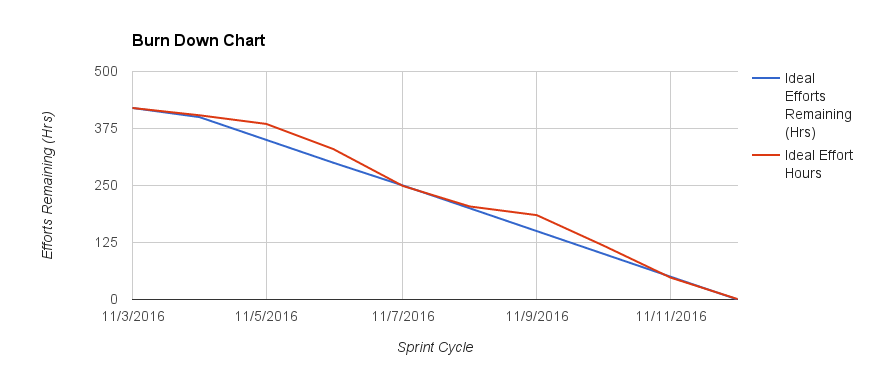 A chart like this depicts that stories or tasks were not estimated correctly during the sprint burndown chart planning meeting, though the commitment is met at the end, the team’s performance has not been consistent. Teams can come across such state when estimation of work is not correctly done. Team did not identify the problems coming before start of the sprint. In retrospection, team should focus on estimating stories correctly. They should rearrange there planning method by correctly calculating team`s load and velocity for coming sprints. Scrum Master should pitch in here and help team identify work estimation problems and guide them and bring them out of this situation.
Sprint commitment met early before time
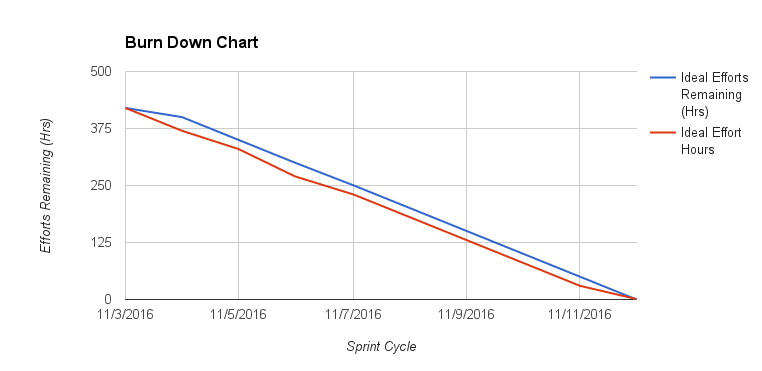 Such situation arises when teams probably overestimated stories without understanding the difficulty of task or committed less during sprint meeting; hence they finished them ahead of time. Also team velocity has not been estimated correctly. Team implemented all committed stories but did not worked on additional backlog stories even they had time to do so. To fix this situation, team should immediately arrange a planning meeting, re-estimate remaining user stories, include them in the sprint according to their velocity and start the sprint. In retrospection meet, scrum master must be proactive in getting his team to fix estimation by providing training after identifying problem areas. He can have a word with product owner and work on backlog stories to be included in sprint.
Avoiding Mistakes While Using Burn-Down Charts
Multiple stories have a common task
There are occasions when different stories may have similar efforts involved. In such cases, if we include these efforts under each story, it will provide incorrect number of total hours, and tracking will hamper. For example, consider "data set-up". This can be common task and applicable for all stories
Tasks are too detailed or huge
Tracking becomes difficult for teams if many tasks are created. At same time, tasks should not be huge in size (ideally not more than 12 hours) else tracking will be painful on daily basis. If tasks are more than 12 hours, it becomes difficult for teams to measure remaining efforts.
Misreading between effort remaining and effort spent
One of the common mistake new scrum teams does in first few sprints is to misread "effort remaining" as "effort spent". When updating effort column every day, team should re-estimate task again and update remaining efforts to complete that task.
Update chart on daily basis without fail
Every scrum team member is required to update “effort remaining”. Every team member representing there scrum teams should update it at the end of the day. This will help teams to come up with burn down charts that depict correct position of scrum teams in ongoing sprints and eventually in the release.
Benefits Of Using Burn-Down Charts
Below are benefits which scrum teams can achieve if burn-down charts are plotted and used effectively on daily basis.
Risk mitigation
Burn down charts provide daily updates on efforts and schedule, thereby mitigating risks and raising alarms as soon as something goes wrong in sprint. Thus providing daily visibility to scrum teams and involved customers and stakeholders. If red line shown in figures above which is actual progress line goes flat and hovers above blue line which resembles ideal line, then the scrum team knows they are in trouble. Risk mitigation can be planned by them immediately rather waiting for end of sprint.
Single communication tool for scrum teams, customers & stakeholders
Burn down charts can be printed and placed in agile rooms or shared at a common place with involved audiences in sprint on daily basis at the end of every day’s work. Thus providing high visibility of scrum team’s progress on sprint which ultimately helps in release completion.
Common planning & tracking tool for scrum team
Scrum teams come up with task breakdown, updates estimated efforts and effort remaining. This enable teams to own the plan made for sprints. Biggest advantage is that entire scrum team is involved in planning and tracking using burn down chart.
Placeholder to track retrospective action items
It's a good practice to add retrospective action items from the previous completed sprint as "non-functional requirements" in the task breakdown for the current sprint. This way, the team targets those action items, and they are also tracked as the sprint progresses.
Conclusion
Sprint burn-downs are usually monitored using effort remaining, it`s a common practice to use story points to monitor release burn-down. After its introduction, many deviations of burn-down charts have been derived. Cumulative Flow Diagram (CFD) is one more favorite tool among agile practitioners which provides greater level of detail and insight into various stages of story. Few practitioners find “burn-up” charts useful at sprint and release level but at the end it all comes up to the end result and how efficiently team uses it to track it`s daily activities at end of the day. However, recent studies show that burn-down charts remain the most favored tracking tool for agile practitioners, due to their effectiveness and simplicity.


Get Started


